Example: More Violence in the Middle?

In this example, we…

  1. download the V-Dem electoral democracy index,
  2. download the dissent scores, and
  3. plot the correlation between the two.

Orienting this correlation theoretically, we quote Muller (1985):

An extremely repressive “closed”-regime structure offers little or no opportunity for dissident groups to engage in collective action of any kind. Moreover, the presence of an extremely repressive regime also affects the first and second variables in the political-process model, since, on the one hand, belief in the likelihood of success of collective protest probably will be low under this condition, and, on the other hand, it surely will be difficult for dissident groups to develop an effective organization. An “open” or democratic regime structure, by contrast, will offer considerable opportunity for dissident groups to participate in a variety of ways in the political process. In addition, belief in the likelihood of success of collective action should be enhanced, as well as ability to organize. In fact, under an open-regime structure, where rights of citizen participation are legally protected, violent collective action should be relatively unlikely, since there are many feasible nonviolent alternatives.

It is under a regime structure of intermediate repressiveness that collective political violence should be most likely. Organization is possible, the cost of collective action is not prohibitive, but opportunities for effective participation are restricted. Consequently, dissident groups operating in a semi-repressive environment may regard civil disobedience and violence as both a feasible and necessary strategy for pressing their claims to a share of infuence over political decisions.

In brief, Muller points out that we should expect dissent in middling regimes. As an example, we show that correlation using our dissent scores and the V-Dem electoral democracy index.

# load packages
library(tidyverse)
library(dataverse)

# download latest vdem data
remotes::install_github("xmarquez/democracyData")
vdem <- democracyData::vdem_simple %>%
  select(year, ccode = vdem_cowcode, v2x_polyarchy) %>%
  glimpse()
Rows: 27,555
Columns: 3
$ year          <dbl> 1789, 1790, 1791, 1792, 1793, 1794, 1795, 1796, 1797, 17…
$ ccode         <dbl> 70, 70, 70, 70, 70, 70, 70, 70, 70, 70, 70, 70, 70, 70, …
$ v2x_polyarchy <dbl> 0.028, 0.028, 0.028, 0.028, 0.028, 0.028, 0.028, 0.028, …
# get dissent scores from dataverse
dissent <- get_dataframe_by_name(
  filename = "dissent-scores.tab",
  dataset  = "doi:10.7910/DVN/CL4CA8",
  server   = "dataverse.harvard.edu", 
  original = TRUE, 
  .f = readr::read_csv) |>
  glimpse()
Rows: 2,775
Columns: 15
$ release             <chr> "V0.1 (Preprint)", "V0.1 (Preprint)", "V0.1 (Prepr…
$ release_date        <date> 2023-12-18, 2023-12-18, 2023-12-18, 2023-12-18, 2…
$ data_source         <chr> "IDEA", "IDEA", "IDEA", "IDEA", "IDEA", "IDEA", "I…
$ created_date        <date> 2023-12-18, 2023-12-18, 2023-12-18, 2023-12-18, 2…
$ country_name        <chr> "United States", "United States", "United States",…
$ ccode               <dbl> 2, 2, 2, 2, 2, 2, 2, 2, 2, 2, 2, 2, 2, 2, 2, 20, 2…
$ stateabb            <chr> "USA", "USA", "USA", "USA", "USA", "USA", "USA", "…
$ year                <dbl> 1990, 1991, 1992, 1993, 1994, 1995, 1996, 1997, 19…
$ n_events            <dbl> 135537, 140735, 151180, 177717, 194368, 195981, 20…
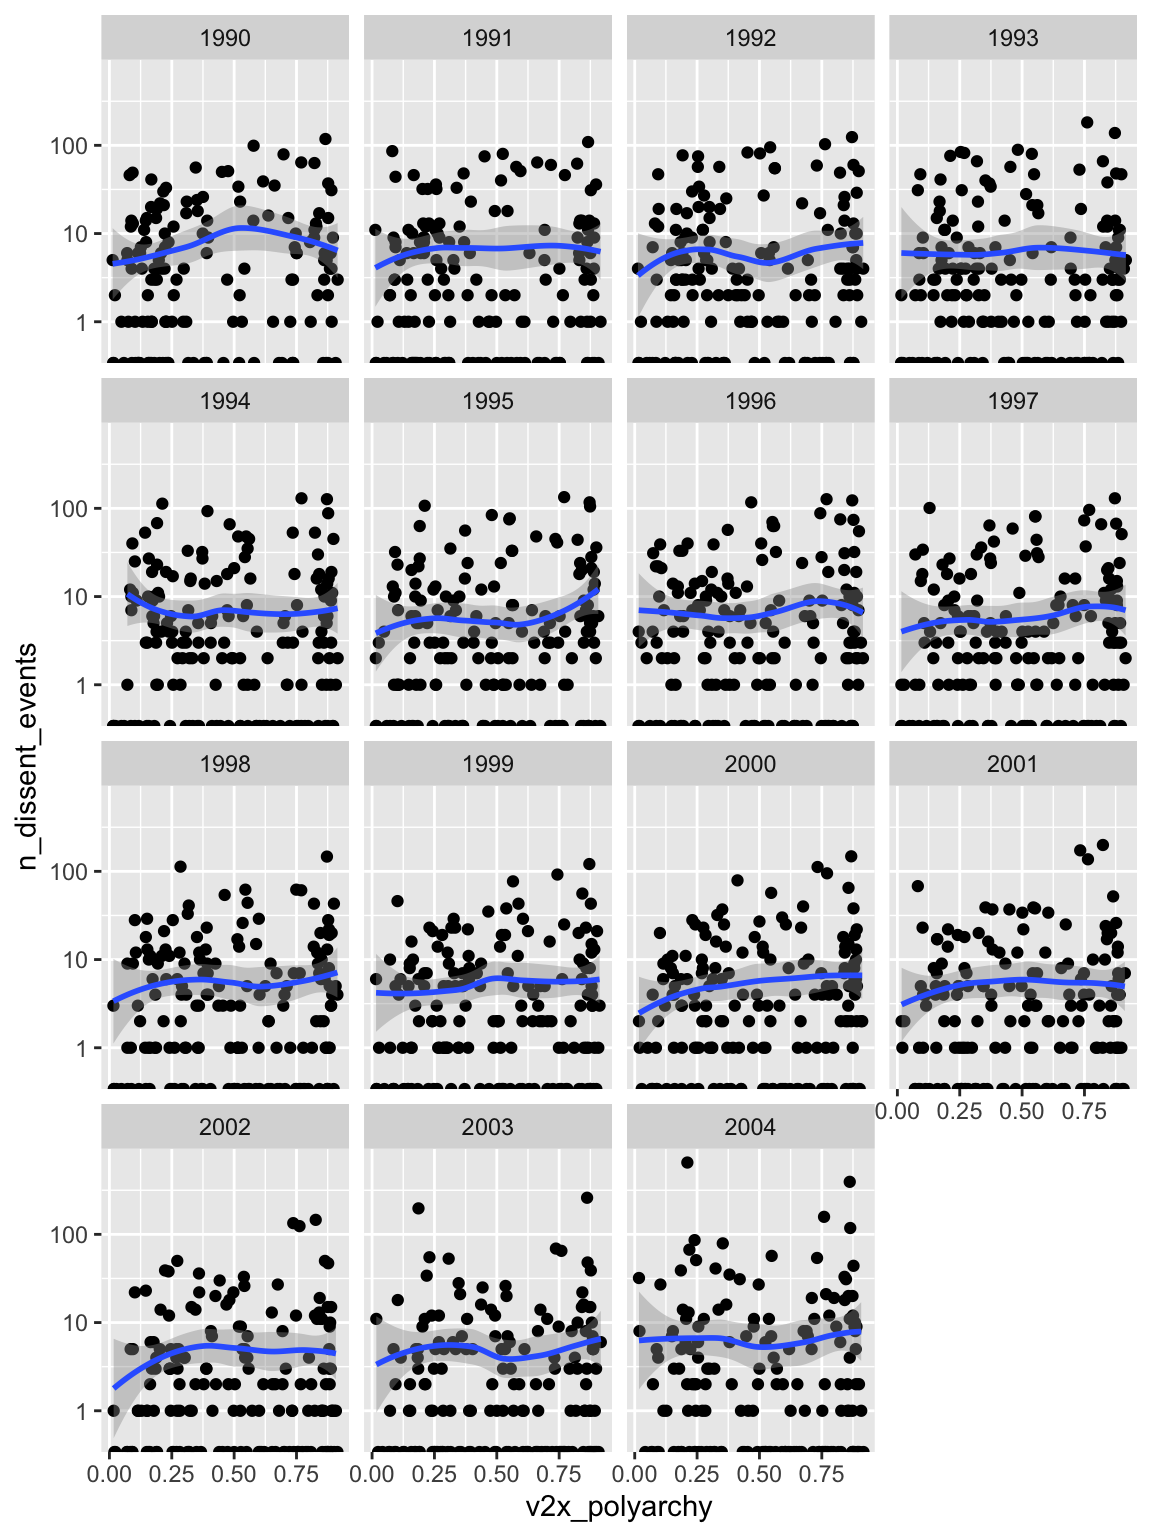
$ n_dissent_events    <dbl> 118, 109, 124, 138, 127, 117, 123, 130, 147, 121, …
$ frac_dissent_events <dbl> 0.0008706110, 0.0007745053, 0.0008202143, 0.000776…
$ avg_pi              <dbl> 0.0008690543, 0.0007750752, 0.0008211722, 0.000779…
$ avg_eta             <dbl> -7.051493, -7.166315, -7.107983, -7.160229, -7.331…
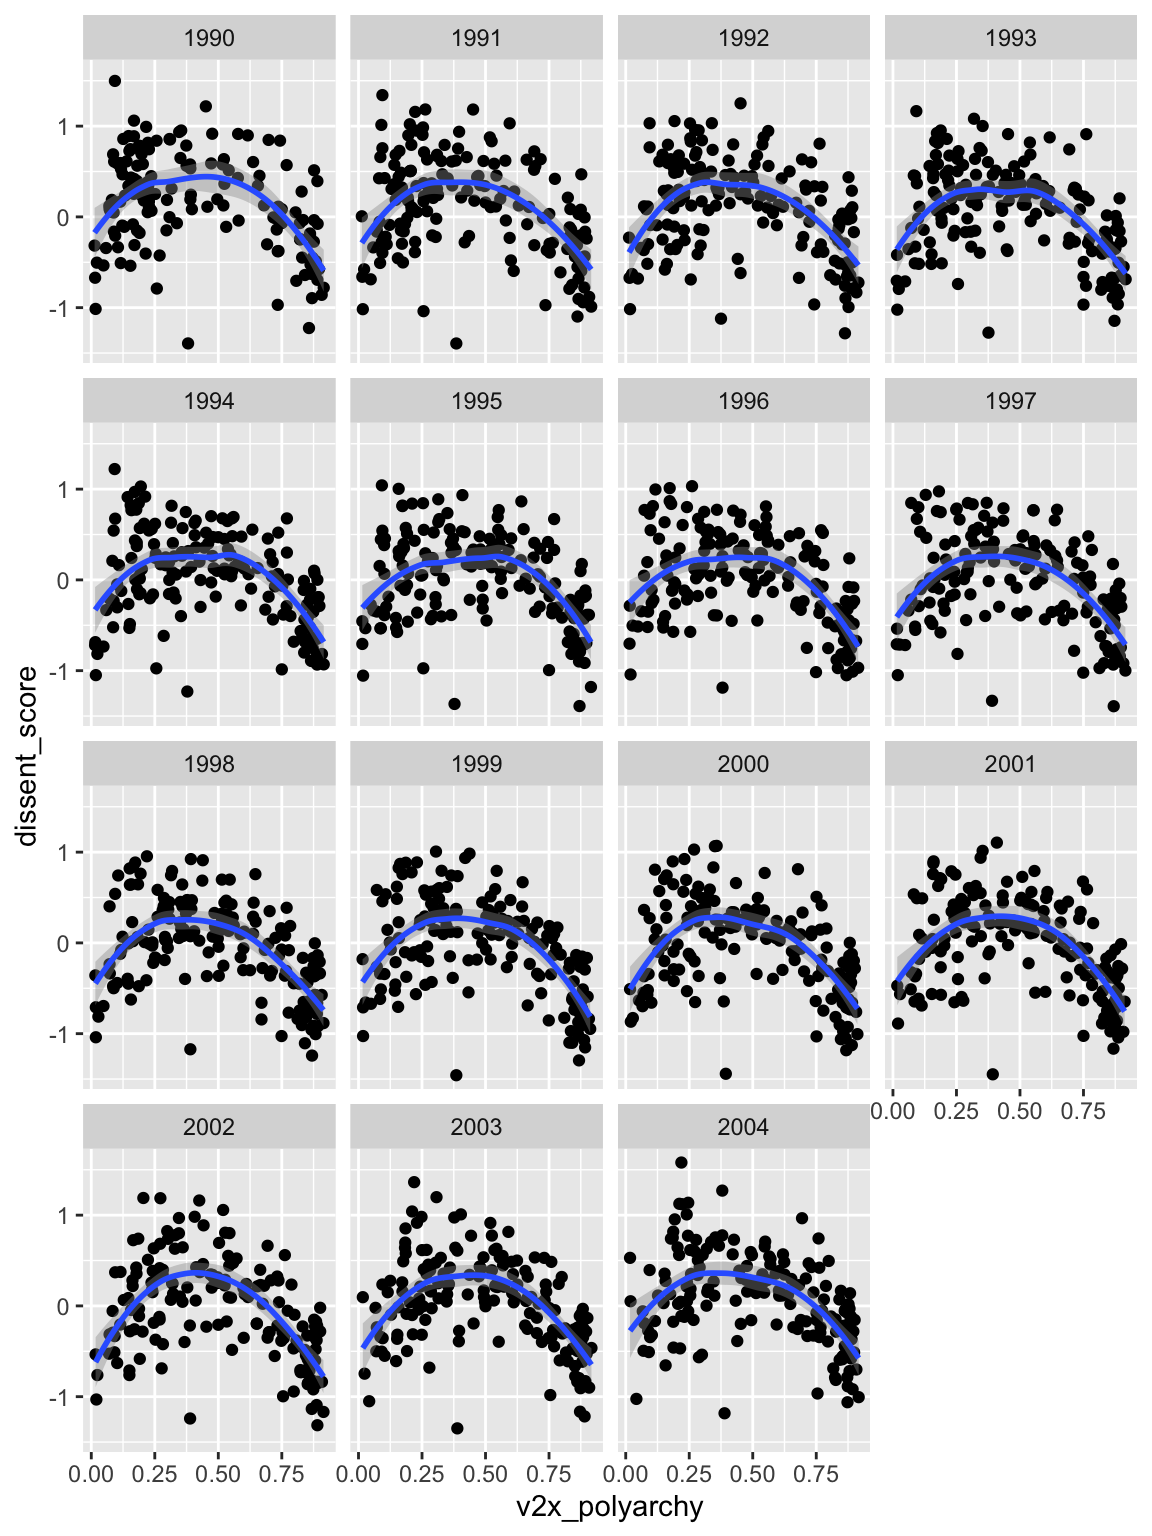
$ dissent_score       <dbl> -0.62807636, -0.67911036, -0.65318394, -0.67640508…
$ se_dissent_score    <dbl> 0.04107096, 0.04241524, 0.03997557, 0.03736980, 0.…
# join the two by ccode and year
joined <- left_join(dissent, vdem)

# plot the relationship between electoral democracy index and dissent scores
ggplot(joined, aes(x = v2x_polyarchy, y = dissent_score)) + 
  geom_point() + 
  geom_smooth() + 
  facet_wrap(vars(year))

When using the number of dissent events, the pattern is not what we would expect.

# plot the relationship between electoral democracy index and the number of dissent events
ggplot(joined, aes(x = v2x_polyarchy, y = n_dissent_events)) + 
  geom_point() + 
  geom_smooth() + 
  facet_wrap(vars(year)) + 
  scale_y_log10()